.png?width=1239&height=378&name=Trinity+(002).png)
Watch this short video to find out how to run your biodiversity report.
Alternatively, follow the steps below.
Step 1
-
Navigate to Sandy's Homepage. Then click into Sustainability on the left-hand side. Next, select Biodiversity, and finally Biodiversity Calculator.
-4.png?width=670&height=379&name=image%20(14)-4.png)
Step 2
-
Click + Create biodiversity report to start running your report
-3.png?width=670&height=378&name=image%20(15)-3.png)
Step 3
-
You can now see your mapped and tabular data provided in onboarding, to review.
-
If any changes or additions need to be made, click the + Add button, and this will take you to the relevant location in onboarding.
-
If a section has missing data, options will appear to add missing data via land use tables or mapping.
-
Once all the data is updated, click Next. at the top of the page.
-
Please note: tabular only data will appear in the land use and feature sections, not on the map.
-3.png?width=670&height=380&name=image%20(16)-3.png)
Step 4
-
This page will present an overview of management practices logged in onboarding.
-
The details can be viewed by year or by land use. Ensure that all the data supplied in onboarding is presented here.
-
if any changes need to be made, please return to the onboarding module, specifically to Activate Services to do so.
-
Once happy, click Create report to generate your biodiversity report.
-2.png?width=670&height=370&name=image%20(17)-2.png)
Step 5
-
This page presents a whole farm report. On the left are scores for each of Sandy's 5 biodiversity metrics. On the right are scores per field.
-
The field can be changed by selecting from the options in the dropdown box above.
-
The year can also be changed by selecting from the options in the dropdown box above.
-
You can click the blue i buttons for further information used in the metrics
-2.png?width=670&height=360&name=image%20(18)-2.png)
Step 6
-
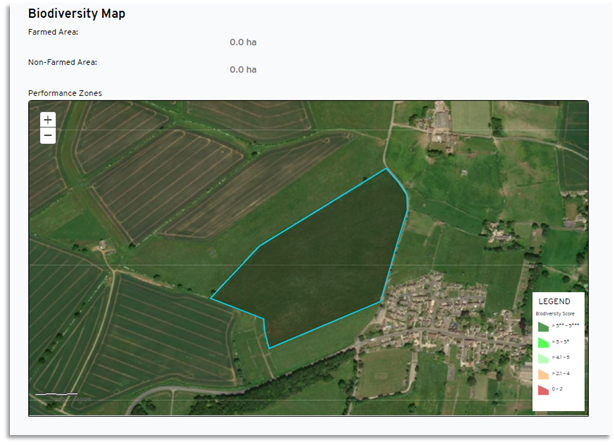
As you scroll down the page, if you provided data via the virtual map, it will be reflected within the relevant field boundaries. If you provided this information via tables, the map will be blank, as shown below.