.png?width=1239&height=378&name=Trinity+(002).png)
Note before starting: You must have completed 3 years of the required data within Sandy Setup to 100% completeness to generate this report.
Or alternatively, follow the steps below.
Step 1
-
Navigate to Sandy's Homepage.
-
From the left-hand side list, select Sustainability, then Water Protection.

Step 2
-
At the top of this page, you'll see an overview of the water protection module.
-
Scroll down to see your data - your Water Protection report will automatically appear on the screen.

Step 3
-
Scroll to the Farm Performance section. This shows your farm's performance in relation to nitrate leaching.
-
Use the blue i button to explore methodology involved in producing your figures.
-
The top section shows your current nitrate leaching performance, plus a prediction for the remainder of the year.
-
The lower section shows this year's nitrate leaching performance compared to the previous year. This is useful to track trends and the effects of management changes.

Step 4
-
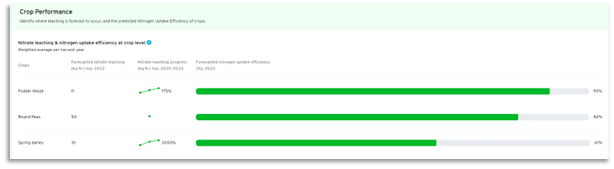
Scroll to the Crop Performance section. This shows individual crop's nitrate leaching performance for the current cropping year. You can also compare current performance to previous years.
-
The progress bars on the right of the page forecast nitrogen uptake efficiency for each crop.
-
As previously, use the blue i button to explore methodology involved in producing your figures.
Step 5
-
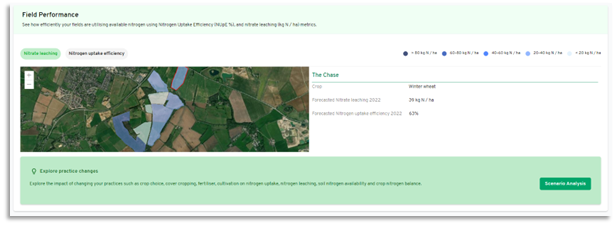
Scroll to the Field Performance section. A map overview of either nitrate leaching or nitrogen uptake efficiency will be visible. Click the two categories to view each of the maps.
-
Your fields will be coloured in line with their performance, per the key in the top right corner.
-
Click on an individual field in the map, the boundaries are highlighted in red, and the key statistics appear on the right.
Step 6
-
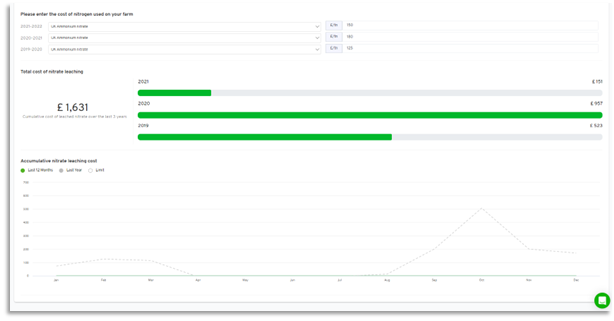
Scroll to the Indicative cost of nitrogen loss through leaching section. This section visualises the cost of nitrogen losses per product and per year.
-
Select the relevant form of nitrogen from the drop down list, and a year, then add in the £/T. You can select multiple years for an improved view.
-
The resultant data shows cumulative and annual costs of leaching.